Test Results - Mine
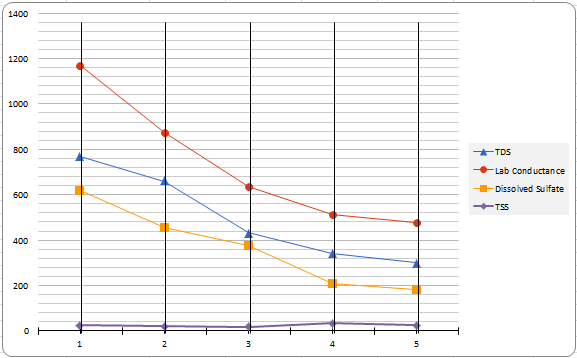
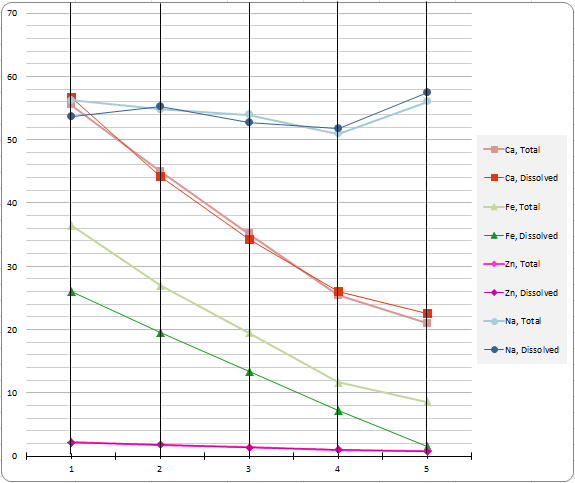
Because our system is configured in stages, each bit of water passes through multiple cavitation pods connected in series. In this configuration we utilized 4 stages, with each stage doing only a portion of the work. For this reason we have taken samples from the output of each individual stage to make it more clear how the individual portions of the system work, as well as how they work as a whole. This also demonstrates how the system can be scaled up or down to obtain desired discharge levels, allowing for a less complex system if acceptable discharge can be obtained after only two to three stages.
The following is an explanation of this spreadsheet:
Sample 1: Beginning sample. These numbers represent the starting point of the water, as it comes out of the ground
Sample 2: Results after the first stage of cavitaion only
Sample 3: Results after the first two stages of cavitation
Sample 4: Results after the first threee stages of cavitation
Sample 5: Results after four complete stages of cavitation. This represents the final output of the system.
| Sample 1 (start) | Sample 2 | Sample 3 | Sample 4 | Sample 5 (finish) | Units | ||
| TDS | 770 | 660 | 432 | 340 | 300 | mg/L | |
| % Reduction | 14.29% | 43.90% | 55.84% | 61.04% | |||
| Lab Conductance | 1170 | 874 | 636 | 514 | 477 | umhos/cm | |
| % Reduction | 25.30% | 45.64% | 56.07% | 59.23% | |||
| Dissolved sulfate | 618 | 457 | 375 | 208 | 184 | mg/L | |
| % Reduction | 26.05% | 39.32% | 66.34% | 70.23% | |||
| Total Alkalinity | 1 | 1 | 1 | 24 | 16.3 | mg/L | |
| % Reduction | 0.00% | 0.00% | -2300.00% | -1530.00% | |||
| Ca | Total | 55.5 | 45 | 35.1 | 25.4 | 21 | mg/L |
| % Reduction | 18.92% | 36.76% | 54.23% | 62.16% | |||
| Dissolved | 56.7 | 44.2 | 34.3 | 26 | 22.6 | mg/L | |
| % Reduction | 22.05% | 39.51% | 54.14% | 60.14% | |||
| Mg | Total | 10.2 | 8.44 | 7 | 5.15 | 4.21 | mg/L |
| % Reduction | 17.25% | 31.37% | 49.51% | 58.73% | |||
| Dissolved | 10.5 | 8.36 | 6.88 | 5.34 | 4.54 | mg/L | |
| % Reduction | 20.38% | 34.48% | 49.14% | 56.76% | |||
| Fe | Total | 36.5 | 27 | 19.5 | 11.7 | 8.6 | mg/L |
| % Reduction | 26.03% | 46.58% | 67.95% | 76.44% | |||
| Dissolved | 26 | 19.5 | 13.4 | 7.23 | 1.45 | mg/L | |
| % Reduction | 25.00% | 48.46% | 72.19% | 94.42% | |||
| Zn | Total | 2.2 | 1.79 | 1.37 | 0.962 | 0.819 | mg/L |
| % Reduction | 18.64% | 37.73% | 56.27% | 62.77% | |||
| Dissolved | 2.19 | 1.8 | 1.4 | 0.981 | 0.783 | mg/L | |
| % Reduction | 17.81% | 36.07% | 55.21% | 64.25% | |||
| Al | Total | 12.2 | 9.46 | 6.75 | 3.07 | 2.3 | mg/L |
| % Reduction | 22.46% | 44.67% | 74.84% | 81.15% | |||
| Dissolved | 12.1 | 9.67 | 5.93 | 0.0832 | 0.0114 | mg/L | |
| % Reduction | 20.08% | 50.99% | 99.31% | 99.91% | |||
| Na | Total | 56.2 | 54.8 | 53.9 | 50.9 | 56 | mg/L |
| % Reduction | 2.49% | 4.09% | 9.43% | 0.36% | |||
| Dissolved | 53.7 | 55.2 | 52.7 | 51.7 | 57.4 | mg/L | |
| % Reduction | -2.79% | 1.86% | 3.72% | -6.89% | |||
| K | Total | 4.48 | 4.18 | 3.82 | 3.51 | 3.09 | mg/L |
| % Reduction | 6.70% | 14.73% | 21.65% | 31.03% | |||
| Dissolved | 4.68 | 4.08 | 3.77 | 3.61 | <5 | mg/L | |
| % Reduction | 12.82% | 19.44% | 22.86% | #VALUE! | |||
| Mn | Total | 2.18 | 1.73 | 1.34 | 0.965 | 0.824 | mg/L |
| % Reduction | 20.64% | 38.53% | 55.73% | 62.20% | |||
| Dissolved | 2.28 | 1.78 | 1.38 | 0.993 | 0.809 | mg/L | |
| % Reduction | 21.93% | 39.47% | 56.45% | 64.52% | |||
| Lab pH | 3.2 | 3.5 | 4.6 | 5.9 | 6.5 | SU | |
| % Reduction | -9.37% | -43.75% | -84.38% | -103.13% | |||
| TSS | 24.5 | 21.5 | 19.5 | 34.5 | 25.6 | mg/L | |
| % Reduction | 12.24% | 20.41% | -40.82% | -4.49% | |||
| Chloride | 11.5 | 10.7 | 11.1 | 11 | 11.9 | mg/L | |
| % Reduction | 6.96% | 3.48% | 4.35% | -3.48% | |||
| Ammonia | 0.081 | 0.053 | 0.02 | 0.03 | 0.041 | mg/L | |
| % Reduction | 34.57% | 75.31% | 62.96% | 49.38% |
Graphs - Click to enlarge